

What Corunner does with Grafana Loki
Agents run log queries when investigating incidents, discover which labels are available so queries stay in scope, and produce evidence links that let humans open Grafana with the exact query pre-loaded.What you get
- Read logs
- Discover labels
- Generate evidence links
Authentication
Authentication depends on the connection mode. Grafana Cloud uses a bearer token. A self-hosted Grafana instance supports a bearer token or basic authentication. A direct Loki connection supports no authentication, a bearer token, or basic authentication.What breaks if you disconnect
- Log investigation
- Incident evidence
Manage this connection
Open Integrations in the Corunner web app, then find Grafana Loki under the Direct Connections tab.Connect Grafana Loki
Open the Connect Grafana Loki dialog and choose the mode that matches your deployment.1. Grafana Cloud
Choose Grafana Cloud, then enter a connection name, environment, Grafana URL, Loki datasource UID, and bearer token. Add a tenant header only if your Grafana Cloud configuration requires one.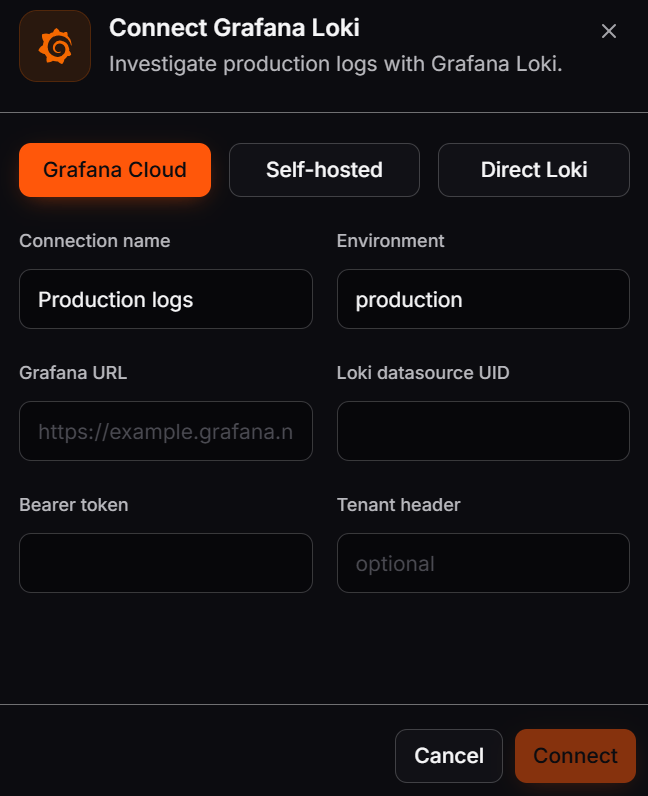
Configure a Grafana Cloud connection in Corunner.
2. Self-hosted
Choose Self-hosted, then enter a connection name, environment, Grafana URL, and Loki datasource UID. Select Bearer token or Basic auth and provide the matching credentials. Add a tenant header only when your deployment uses one.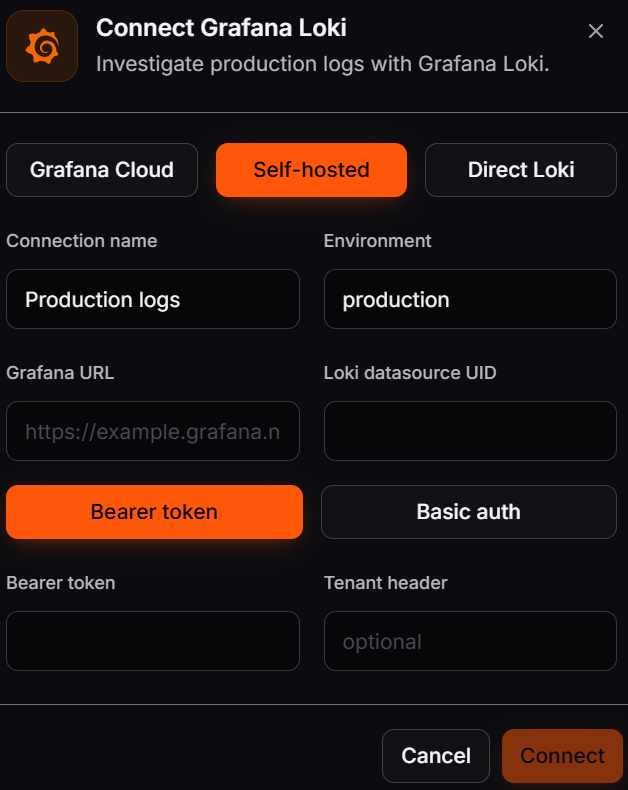
Configure a self-hosted Grafana connection and select its authentication method.
3. Direct Loki
Choose Direct Loki when Corunner should connect to the Loki endpoint without going through Grafana. Enter a connection name, environment, and Loki URL. Then select No auth, Bearer token, or Basic auth to match your Loki deployment.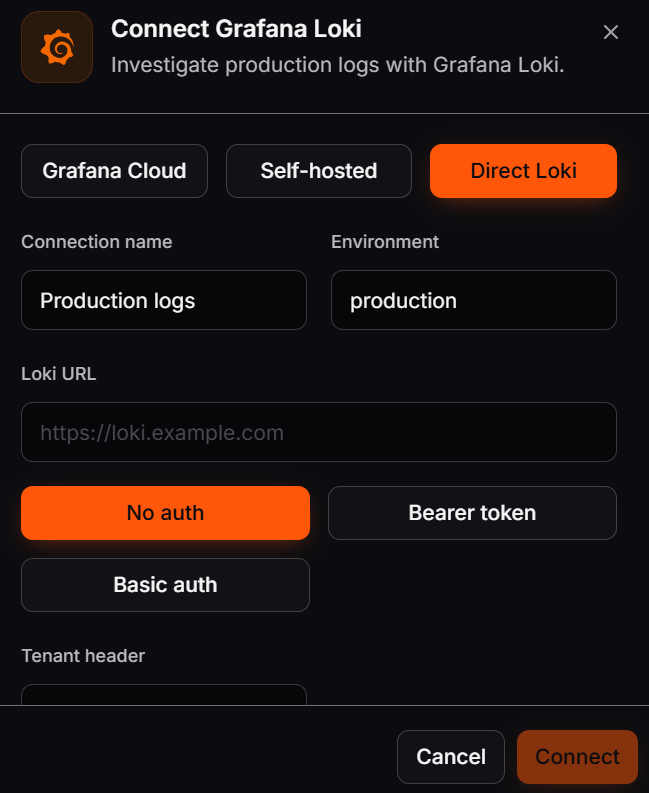
Configure a direct connection to a Loki endpoint.